Focus
Targeted Support
Allocate resources where they are needed most based on data-driven insights.
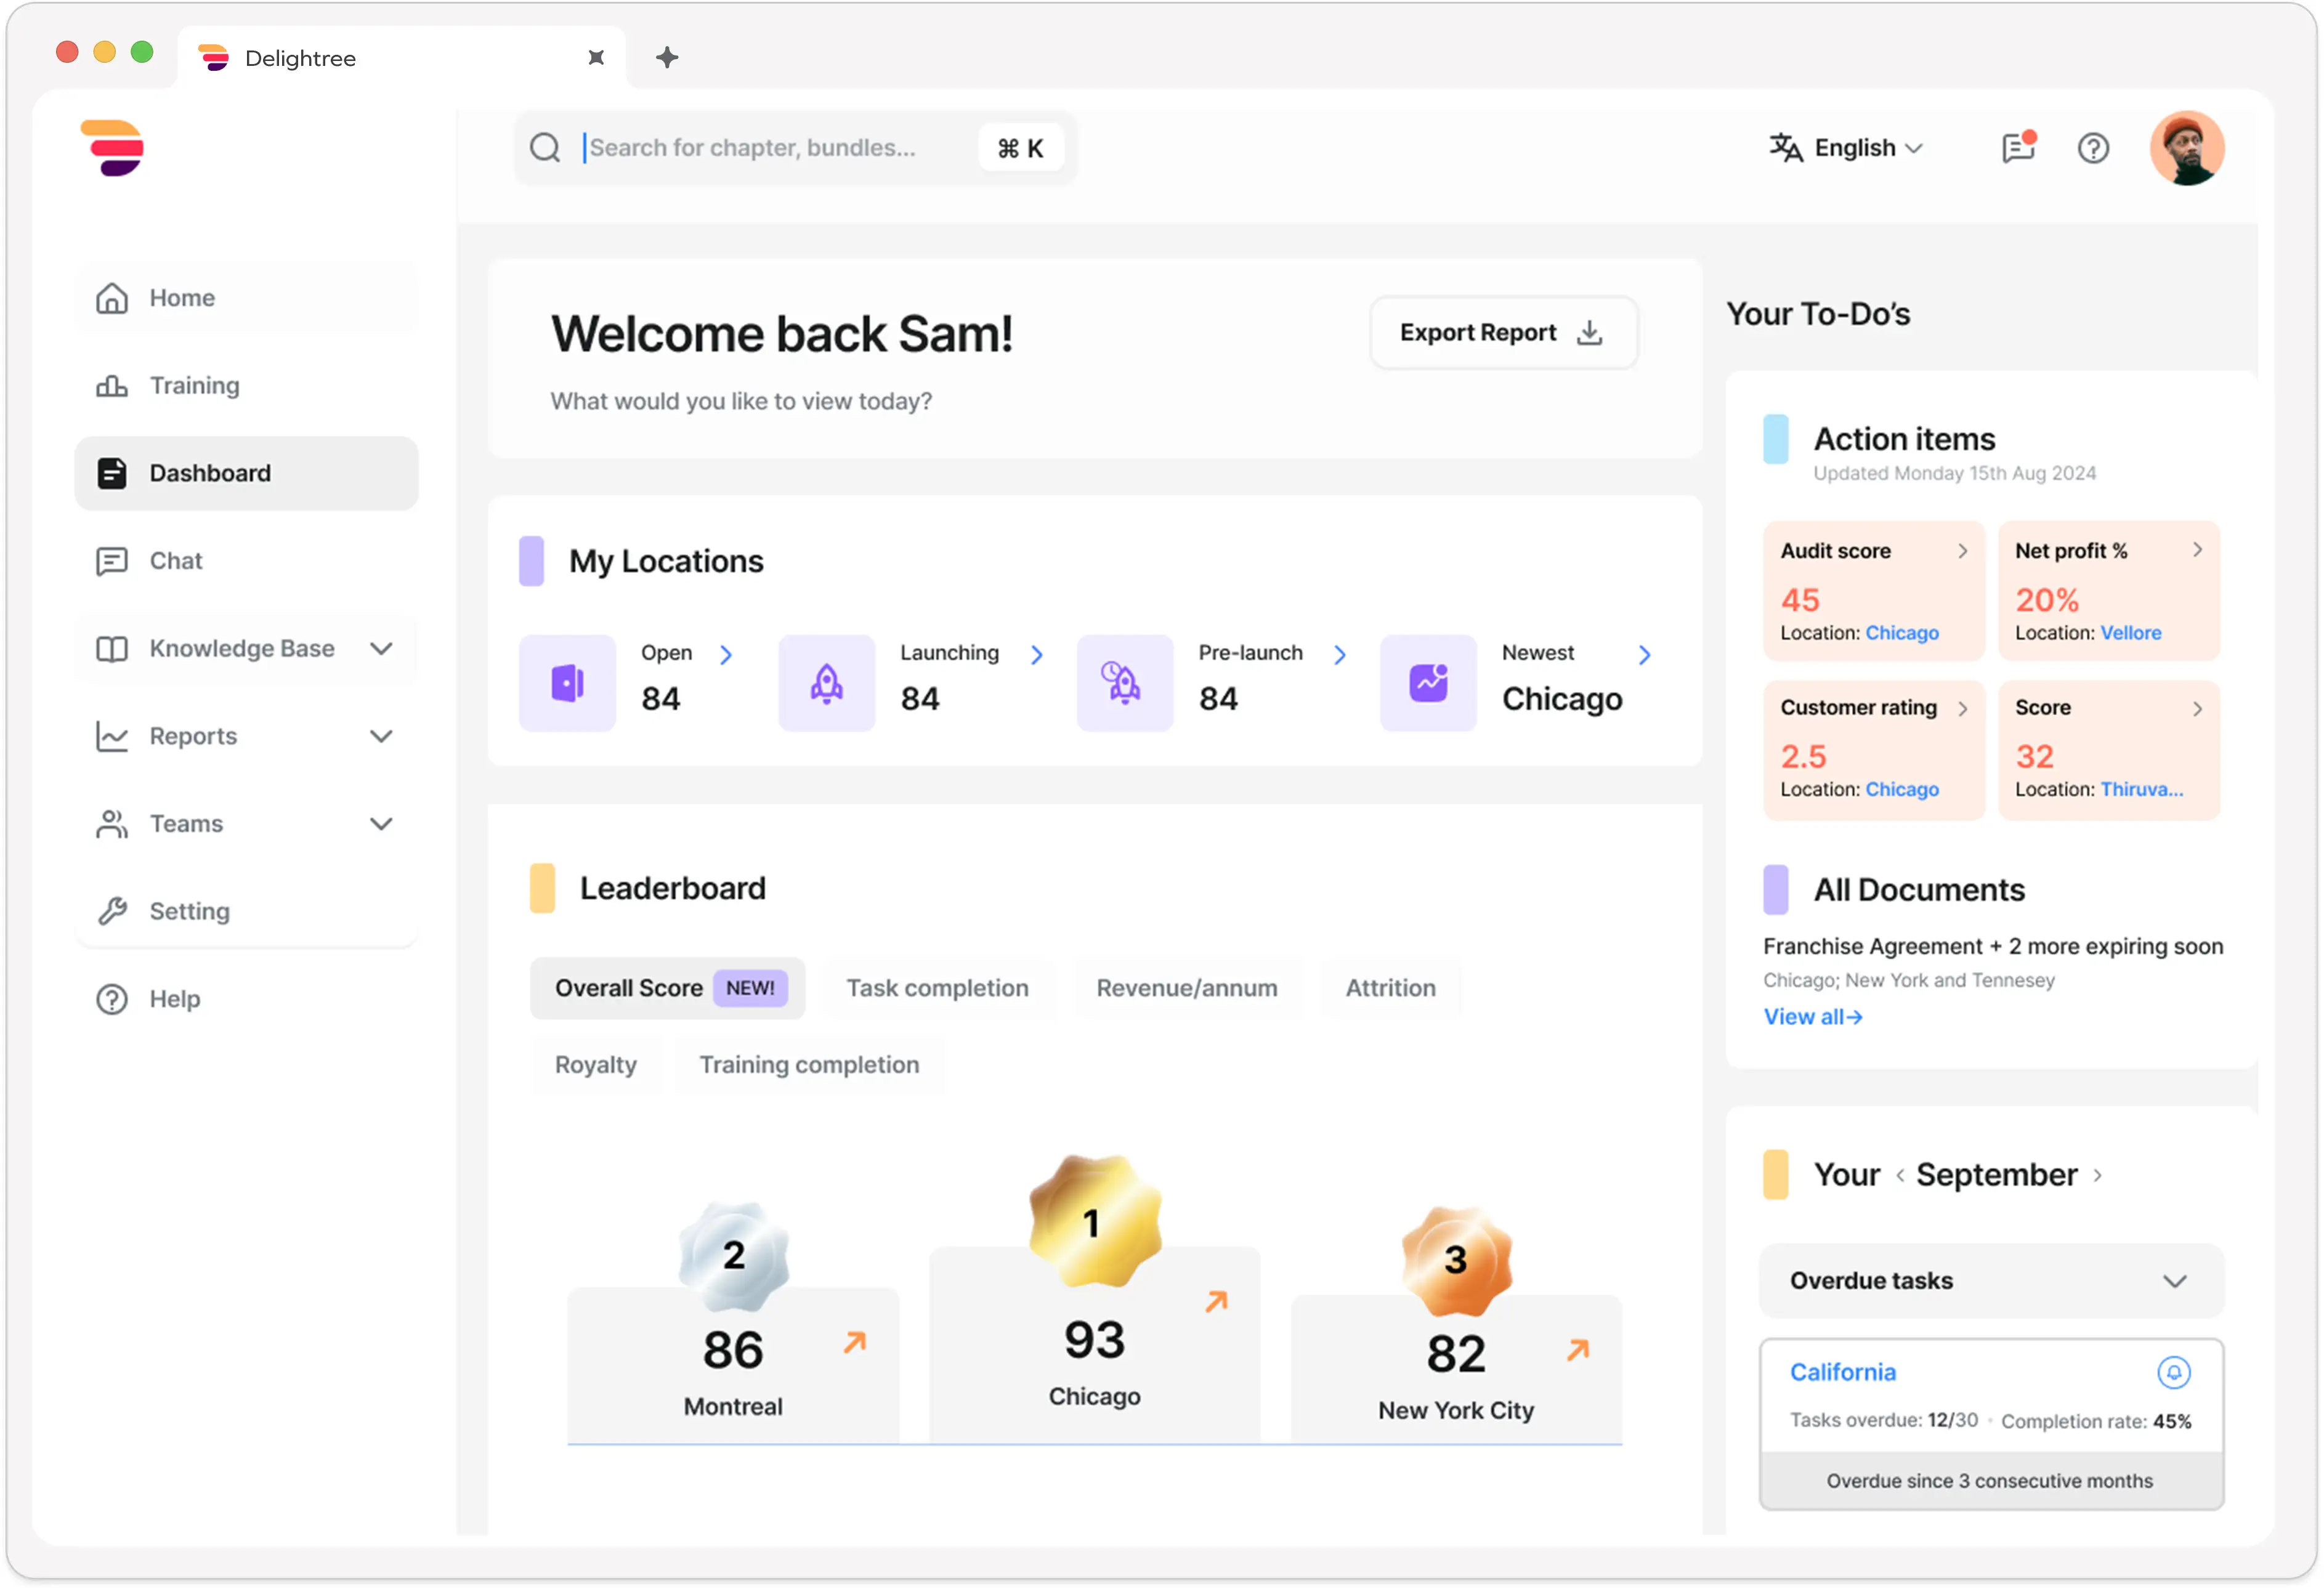
Instantly visualize franchise performance, track engagement, and make data-driven decisions to optimize support and drive network-wide growth.









Trusted by franchise and multi-location brands
Understanding your franchise network's performance is crucial for continuous improvement and growth. Gain valuable insights into engagement levels and operational efficiency. These insights enable you to make informed decisions that enhance support, optimize resources, and improve overall system effectiveness.
In the words of franchise operators who rely on drive-bys and weekly updates to see how locations are doing.
“Things fall through the cracks because it all relies on one person having visibility. We're only getting updates weekly.”
“We wouldn't really know how a location is doing unless we drove out there and looked.”
“Everything relies on one person having visibility, and we're only getting updates weekly. Things fall through the cracks.”
“We have a lot of really qualified, talented people updating Google sheets every day. That's where our productivity is going.”
Harnessing data helps franchise leaders:
Spot patterns in performance across locations to inform strategy.
Tailor assistance based on specific franchisee needs and challenges.
Make strategic decisions backed by solid data and real-world performance metrics.
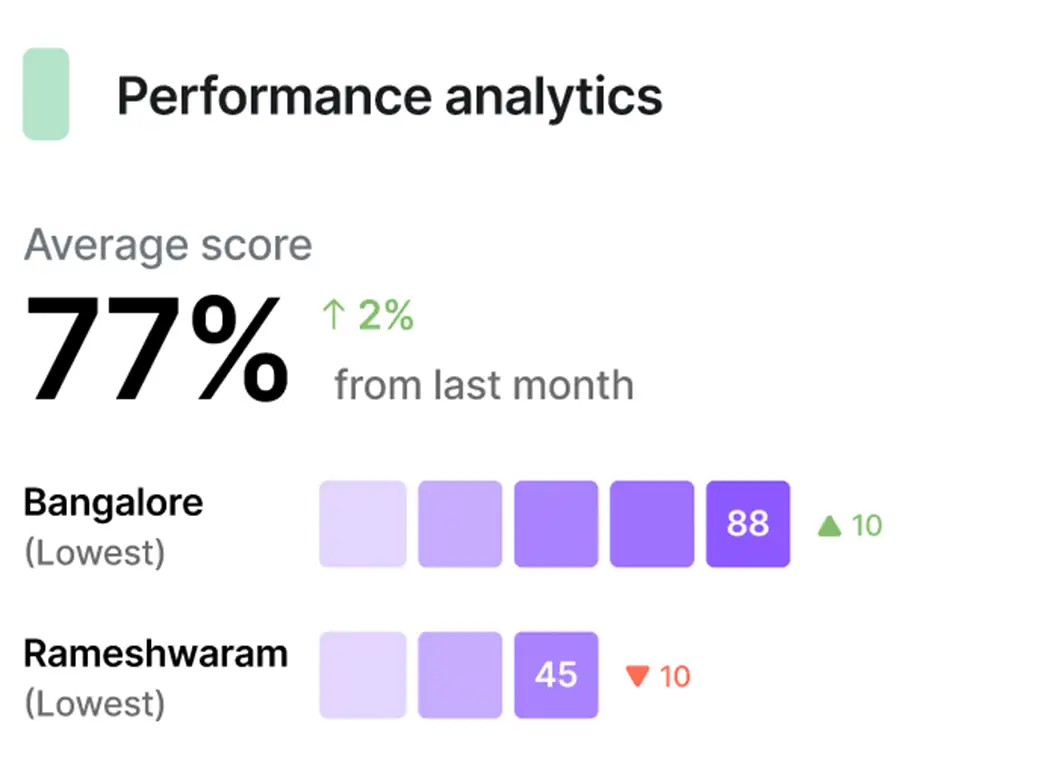
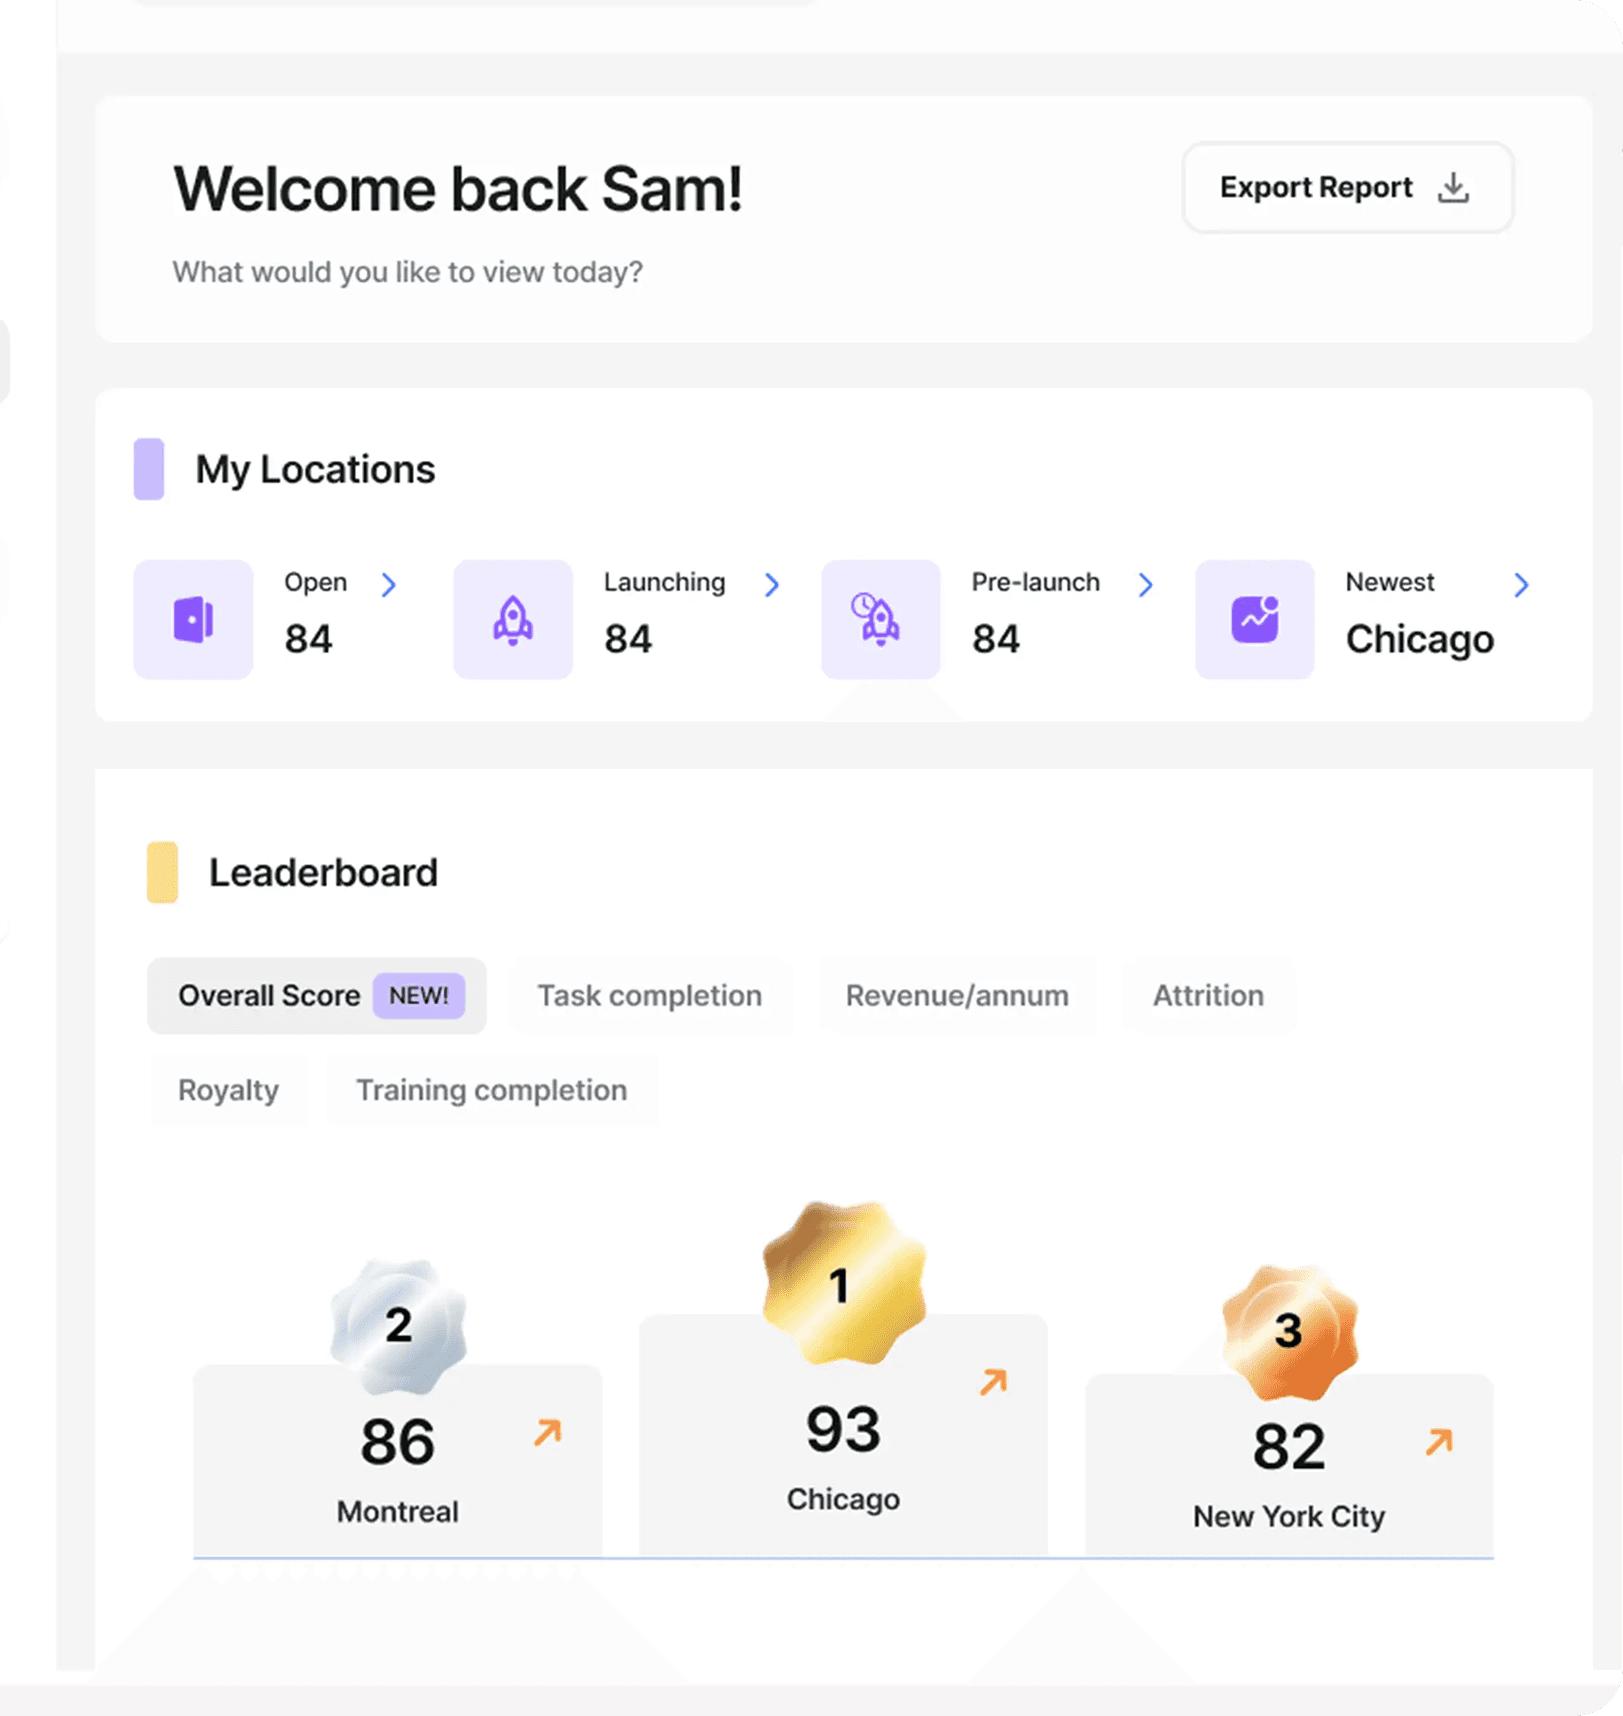
Access up-to-date information on key performance indicators through real-time data dashboards. Customize views to focus on the metrics that matter most to your franchise.
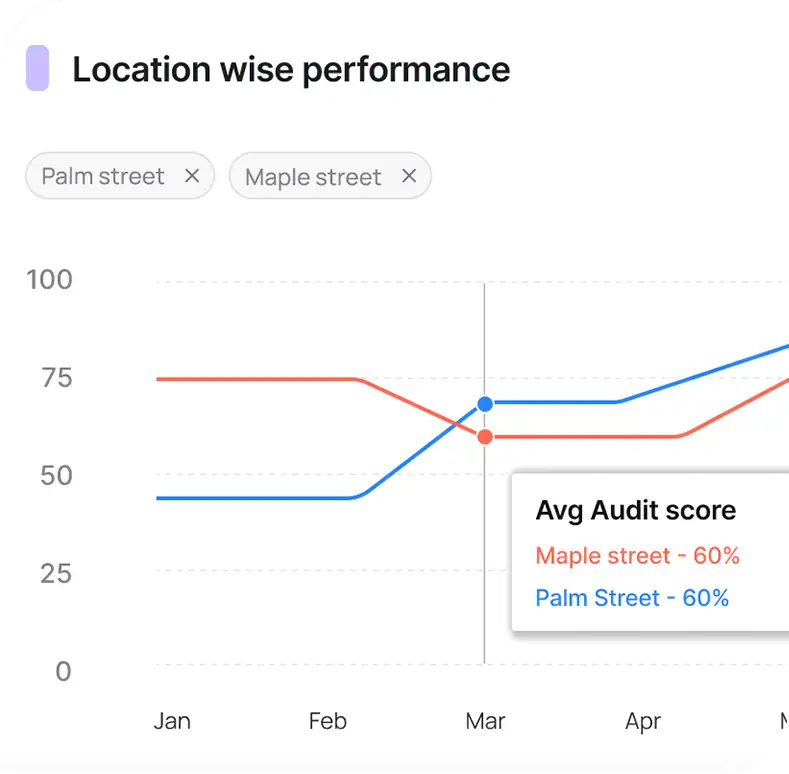
Monitor how franchisees interact with training materials, tasks, and resources. Track completion rates for tasks and training to identify potential bottlenecks or areas for improvement.
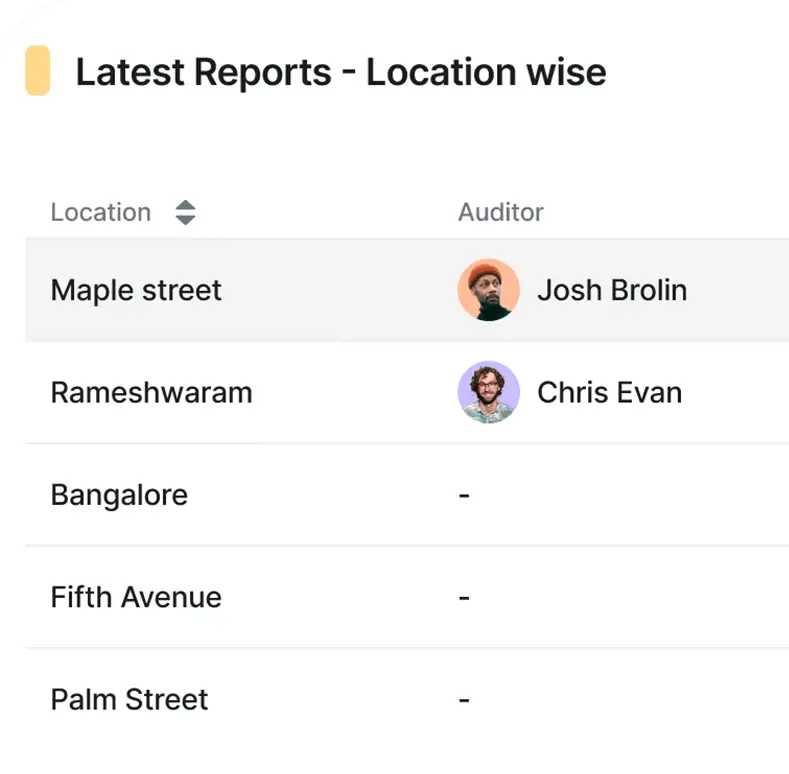
Track task completion, training, audits, and launch status across your network in real time. Each role sees its own slice of the hierarchy.
Focus
Allocate resources where they are needed most based on data-driven insights.
Coordination
Address common challenges across your network before they become widespread issues.
Improvement
Use insights to refine operations, training, and support strategies over time.
Franchisors using our analytics have reported:
Improved franchisee performance through targeted interventions based on data insights.
Increase franchisee satisfaction by giving them the data they need to grow their business.
Tony Roma's replaced weekly spreadsheet check-ins and status calls with real-time location visibility through Delightree's Location Launcher.
SubContain eliminated 4 hours per week of manual spreadsheet work.
Most franchise brands pull performance numbers from spreadsheets, a training tool, a task app, and audit forms, then combine them by hand. Delightree replaces the stack.
Dashboards show task completion, training, audits, and launch status in real time. You can customize views to focus on the metrics that matter most to your franchise.
No. Dashboards are role-scoped, so each role sees its own slice of the hierarchy.
Yes. Engagement metrics show how franchisees interact with training materials, tasks, and resources, including completion rates.
Yes. The dashboards work on mobile phones, so you can check location performance away from your desk.
No. Our team moves your existing reporting needs into Delightree for you.
Learn how Delightree's Reports and Analytics can help you make smarter, data-driven decisions for your franchise.